
A hospital CFO signing off on a $400,000 operating room upgrade needs proof the investment pays off before the next capital budget cycle closes. That’s the real question behind every search for growth in the surgical tables and lights market right now: is this the window to move, or noise dressed up as opportunity?
The numbers say the window is real. Rising surgical volumes tied to an aging population, plus the steady shift toward minimally invasive procedures, are pushing hospitals to replace aging electric surgical tables and outdated lighting with LED surgical lights built for precision and speed. But raw growth percentages don’t tell you which manufacturer fits your budget, your case mix, or your service expectations.
The rest of this breaks down the forecast data, the regional shifts worth watching, and how leading surgical equipment manufacturers stack up side by side. You’ll be able to decide not just whether to invest, but where, how much, and with whom.
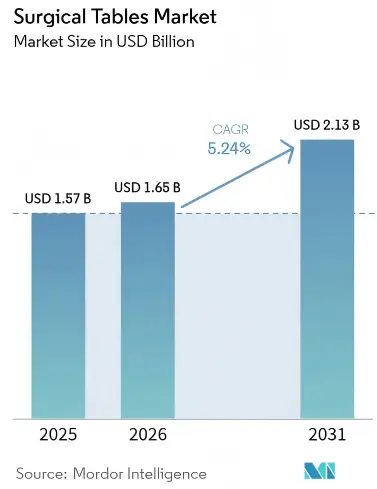
2026–2030 Surgical Tables Market Size and Forecast Scenarios
No single number captures where this market is headed. Analysts covering surgical equipment manufacturers can’t even agree on the starting point, let alone the finish line. That disagreement matters if you’re the one signing a purchase order.
Pull together the major industry reports and three scenarios emerge for the surgical tables market:
Bull case: USD 1.50 billion in 2023 climbing to USD 2.34 billion by 2030, a 6.6% CAGR from 2024 onward.
Base case: USD 1.45 billion in 2024 reaching USD 2.15 billion by 2030, at 6.8% CAGR — the range cited most consistently across market research firms.
Bear case: growth stalling near USD 1.43 billion by 2030, just 4.0% CAGR if hospital capital spending tightens.
A separate track puts 2024 at USD 1.64 billion, ending near USD 2.06 billion by 2030 at 6.79% CAGR. That is close enough to the base case to confirm the mid-single-digit growth band is real.
Three forces repeat across every report: rising surgical volumes from an aging population, faster adoption of minimally invasive surgery equipment requiring image-guided compatibility, and orthopedic surgery demand pushing patient positioning systems upgrades. Specialty surgical tables built for bariatric, spine, and orthopedic cases are the fastest-growing segment inside this market, outpacing standard general-surgery tables.
Faster replacement cycles and higher reimbursement rates keep North America the largest regional market. Those conditions support operating room modernization.
For budgeting purposes, treat USD 2.1–2.34 billion by 2030 as the realistic planning range, not the single-point estimates vendors will quote you.
2026–2032 Surgical Lights Market Trends and Forecast Range
Ask five research firms for the size of the surgical lighting technology market and you’ll get five different answers. That’s not a data quality problem — it’s a segmentation problem. Some reports fold in headlamps and ambient OR lighting. Others isolate only overhead LED surgical lights. The gap between estimates is wide enough to change a procurement conversation.
Three forces push every scenario upward, not downward: LED systems replacing halogen units for better energy efficiency and lower maintenance, rising surgical volumes from more invasive procedures, and hospital infrastructure investment flowing into integrated operating room builds. Shadow-reduction technology and light-control integration keep showing up as the features hospitals will pay a premium for.
One combined dataset tracks surgical tables and lights together at USD 1.8 billion in 2023, reaching USD 2.7 billion by 2032 — a steadier 4.5% CAGR that smooths out the lighting-only volatility above.
Combined Surgical Tables and Lights Market Growth Outlook
Every forecast model tells a different story, but the endpoints land in the same neighborhood. One outlook pegs the combined market at USD 1.7 billion in 2026, growing to USD 2.6 billion by 2033 at a 5.4% CAGR. A separate industry view starts higher — USD 1.88 billion in 2024 — and lands at USD 2.89 billion by 2034, tracking a more conservative 4.4% CAGR. Neither figure contradicts the other; they just measure different windows.
Zoom into the lighting segment alone and the pattern holds. Surgical lights are projected to move from USD 813.29 million in 2026 to USD 1.19 billion by 2034. At 4.9% CAGR, lighting is a strong sub-driver in the combined figure.
Three catalysts keep showing up across every model: rising surgical volumes, aging populations, and growing chronic disease burden pushing hospitals toward advanced operating room equipment. On the technology side, LED lighting, integrated surgical environments, robotic surgery compatibility, and 3D-vision OR systems dominate the upgrade conversation. High equipment costs, tight regulatory approval cycles, and a shortage of trained OR staff remain the recurring friction points slowing faster adoption.
For sourcing purposes, treat 4.5%–4.9% CAGR as the defensible planning midpoint, with combined market size settling between USD 2.6–2.9 billion by the early 2030s. Vendor sourcing conversations reference Grace Medy, Stryker, Getinge, Maquet, Steris, Trumpf Medical, Hillrom/Baxter, Skytron, and Mizuho OSI as the core competitive set.
Regional Surgical Tables Market Share and Growth Signals
Geography decides who wins the next procurement cycle. North America still leads, but the exact size of that lead varies by metric. Revenue-share estimates put the region at 38.30% in 2025, and unit-shipment models land closer to 31–35%. Either way, faster replacement cycles and richer reimbursement keep this the market every surgical equipment manufacturer prioritizes first.
Europe holds second place at roughly 28–30% of global units, driven by a documented 12.5% replacement rate for equipment older than eight years. That’s an aging installed base translating into new orders.
Asia Pacific is growing the fastest. CAGR estimates range from 6.56% to 8.5%, fueled by hospital construction, medical tourism, and robotics-ready OR builds, not replacement demand.
Smaller markets matter too. Middle East, Africa, and Latin America combine for roughly 11% of global units, growing on tourism and hospital expansion.
Sizing estimates diverge sharply. One report projects USD 1.19 billion by 2025 at 6.1% CAGR; another forecasts USD 968.2 million at 3.9% CAGR. Outpatient surgical volume, growing 9.2% annually in North America, and hybrid OR adoption explain why powered, imaging-compatible tables keep outpacing standard models.
Surgical Tables and Lights Market Growth Drivers Through 2030
Hospitals aren’t buying new surgical tables and lights because the old ones are broken. They’re buying because the entire operating room model is shifting.
One forecast puts the global surgical lights market at USD 1.85 billion in 2023, climbing to USD 2.74 billion by 2030 at a 5.9% CAGR. A more conservative estimate lands at USD 820 million in 2024, reaching USD 1.12 billion by 2030 at a 5.3% CAGR. The combined tables-and-lights market shows a steadier 3.7% CAGR. That growth is tied directly to rising surgical volumes, medical technology upgrades, and healthcare infrastructure expansion.
Four forces are driving that growth:
Smart OR buildouts. IoT connectivity, automation, and imaging-compatible systems are now baseline expectations.
Ambulatory surgery centers. The shift toward outpatient care is creating demand for compact, flexible tables and lighting that don’t need full hospital-scale infrastructure.
Product innovation. Electrically powered tables, hybrid OR equipment, antimicrobial surfaces, and ergonomic redesigns are replacing legacy manual systems.
Regulatory pressure. Tighter sterilization, interoperability, and infection-control standards are pushing procurement teams to upgrade sooner than planned.
None of these forces operate in isolation. Together, they explain why replacement decisions are accelerating well ahead of typical equipment lifecycles.
Operating Room Tables and Lights: Technology and Specification Comparison
Specs on a data sheet mean nothing until you match them against what your surgical team actually needs on a Tuesday morning case load. That’s the gap this comparison closes.
Table specifications worth negotiating on:
Tabletop dimensions: Standard catalog examples run 2000–2200 mm in length and 500–600 mm in width. One common product spec is a 550 × 2200 mm top, with height ranging from 580 mm minimum to 980 mm maximum. Another catalog lists a narrower 540 mm width with a 750 mm minimum height. These small differences matter for bariatric or pediatric case mixes.
Load capacity: 250 kg is the modern minimum benchmark. Advanced models push 200–300 kg standard, and bariatric-specific tables are rated 400+ kg.
Height adjustment: Electric tables typically range 450–1050 mm; tighter catalog examples show 580–980 mm.
Positioning range: Trendelenburg/reverse Trendelenburg from 25° up to ±35°, lateral tilt 15–25° or up to ±20°.
Imaging compatibility: Radiolucent, carbon-fibre tabletops with 250–300 mm longitudinal movement are now standard for C-arm access and are non-negotiable for hybrid ORs.
Light specifications that separate premium from budget:
Illuminance: 40,000–160,000 lux is typical ceiling output, against a 10,000 lux minimum field requirement. Design manuals cite 3,000 lx at the table surface and 15,000 lx at the surgical field.
Color rendering: CRI ≥90 is standard; premium vendors quote Ra 93–97.
Color temperature: 3,500–5,000 K covers most procedures.
LED lifespan: 50,000+ hours versus roughly 2,000 hours for halogen. That’s a maintenance-cost argument by itself.
When shortlisting, pair a 250–300 kg, 450–1050 mm table with a 40,000–160,000 lux, CRI 90+, 3,500–5,000 K light. That gives you a comparable benchmark across manufacturers.
Surgical Equipment Manufacturers: Technology, Price, and Service Positioning
Not every surgical equipment manufacturer is selling the same thing, even when the spec sheets look identical. Three positioning models dominate this space, and picking the wrong one costs more than the invoice suggests.
Premium tech-led players compete on innovation. Medtronic’s Signia™ linear stapler is the clearest example: Tri-Staple™ technology, Adaptive Firing™, a powered handle with an OLED display. You pay for intelligence built into the device, not just the steel.
Compliance-and-customization exporters sit at the opposite end. Pintech Instruments runs ISO 13485 certified production out of Pakistan, exports FOB Sialkot, and carries 1,359+ catalog items. MOQs run 10–25 pieces per item, 5 sets for complete kits, with OEM and private-label options and 1–5 piece samples before bulk orders. That is a broad-line, factory-direct model built for distributors and hospital procurement teams optimizing cost, not chasing features.
Value-pricing manufacturers occupy the middle. One device maker restructured its pricing line-by-line and unlocked $2.6M in margin. Price architecture, not just unit cost, drives profitability here.
For baseline benchmarking, expect electro-hydraulic tables with 700–1100 mm height range and 360° rotation, paired with LED lights rated 100,000–160,000 lux at 4000–5000K, regardless of which tier you are buying from.
Hospital Procurement Priorities by Facility Size and Budget
Bed count decides the entire negotiation before anyone opens a catalog. A 150-bed facility and a 600-bed system are shopping the same surgical tables and lights market, but they’re solving completely different problems.
Under 200 beds run on cost control and workforce retention. These buyers gravitate toward refurbished equipment — often 50–70% cheaper than new — plus local service contracts that avoid stockouts. Benchmark data shows 40% of small hospitals prefer Tier 3 regional vendors specifically for that reason.
200–499 beds shift toward standardization and supply reliability, balancing cost against service contracts that reduce transaction overhead.
500+ beds and multi-site systems flip the priority stack entirely: digital integration, capex expansion, enterprise uptime guarantees. These buyers show 42% preference for Tier 1 multinational vendors and use volume contracting to secure 15–25% lower pricing than standalone surgery centers.
Budget math backs this up. Biomedical equipment typically consumes 15–25% of a new hospital project budget, with operating theaters claiming 15–20% of that allocation. Annual capital equipment spend usually runs 3–6% of net patient revenue — a useful ceiling when sizing your surgical tables and lights line item against the rest of the capital plan.
Surgical Suite Modernization Investment and Supplier Selection Metrics
Renovation budgets swing wildly depending on how deep you cut. Cosmetic refreshes run $40–$80/sq ft. Partial mechanical upgrades climb to $80–$175/sq ft. Full mechanical work hits $150–$300/sq ft, and a complete gut-and-rebuild reaches $250–$500/sq ft. Adding a new OR to existing space costs $400–$800/sq ft.
Shell benchmarks tell the same story at scale. A standard hospital-grade OR shell prices at $1,850–$2,650/SF in 2026, which works out to about $1.1M–$1.6M for a 600 SF room. A hybrid OR with fixed imaging runs $3,200–$4,850/SF, or $2.3M–$3.5M for 720 SF. Real projects confirm the range: one health system budgeted $8.5M for a suite renovation, another $18M, and a five-OR expansion plus three-room retrofit landed at $29M, with activation equipment alone adding $126,000 per OR.
Vendor selection matters as much as square footage. Buyers keep coming back to the same sourcing criteria: price, quality, logistics, sustainability, and OHS compliance, along with on-time delivery, service performance, and technology capacity. They also check ASHRAE 170 readiness, medical gas qualification, and ISO/TC 170 alignment before signing.
Conclusion
Growth in the surgical tables and lights market is happening now. Aging populations, the shift toward minimally invasive surgery, and hospitals modernizing ORs built ten years ago are driving it. Those numbers are useful data is useless on its own in a budget cycle. What actually matters is translating market share, regional signals, and manufacturer positioning into a decision your CFO or board will back.
If you run a 200-bed community hospital, your decision will look different than a tertiary academic center. It should. Use the manufacturer comparison framework here as a starting point, not your final answer. Get quotes from at least three vendors, benchmark against your case volume, and revisit your capital plan before this fiscal year closes. The window for smart, forward-compatible investment is open but it won’t stay that way forever.