
Global surgical volumes are climbing, hospital budgets are tightening, and OR directors are under mounting pressure to justify every capital equipment purchase—which is why the powered operating tables market is drawing sharper scrutiny from procurement teams and investors alike. What was once a straightforward hydraulic-versus-electric decision has evolved into a far more complex evaluation involving connectivity, automation, and long-term total cost of ownership.
This market analysis breaks down where the growth is coming from, which technology segments are pulling ahead, and how regional dynamics in North America, Europe, and Asia-Pacific are shaping vendor strategies differently. We’ll also look at what’s separating the manufacturers gaining share from those losing ground—and what that means for anyone making a purchasing or investment call over the next decade.
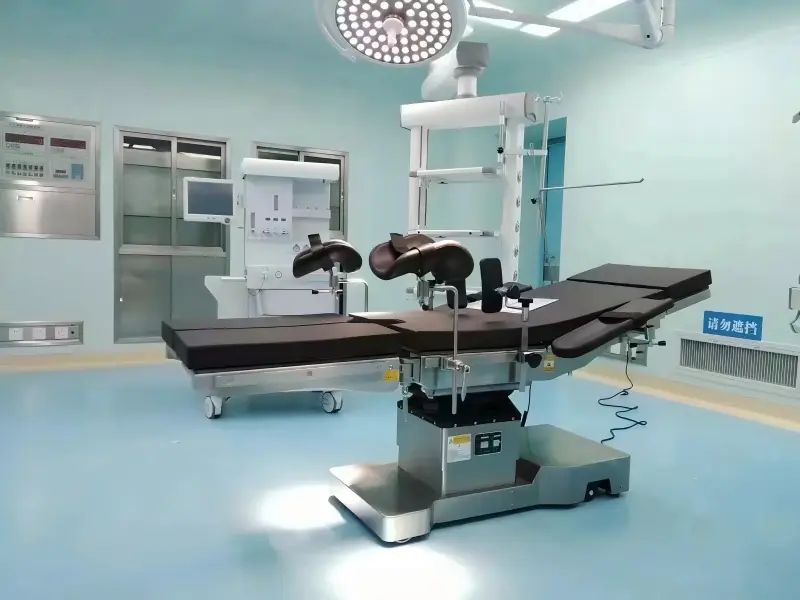
Powered Operating Tables Market Size And Growth Trajectory (2024-2035)
Numbers don’t lie, and the numbers here tell a compelling story. MRFR pegs the global powered operating tables market at USD 1.36 billion in 2024, climbing to USD 1.478 billion in 2025. By 2035, that figure hits USD 3.395 billion—a 2.3x expansion over ten years, driven by an 8.67% CAGR.
Where the powered share is heading
Powered tables already commanded roughly 55-70% of value share within the broader operating table category as of 2024-2025, based on Persistence and Reanin estimates. Global Market Insights puts the powered share of surgical tables even higher—around 83% in 2025.
The trajectory only tightens. Industry analysts expect powered tables to exceed 80% of total market value by 2031-2035, as non-powered inventory ages out and replacement cycles favor motorized, electric-driven systems. For hospital procurement managers and equipment distributors, this is the current default purchasing pattern reshaping how operating rooms are equipped.
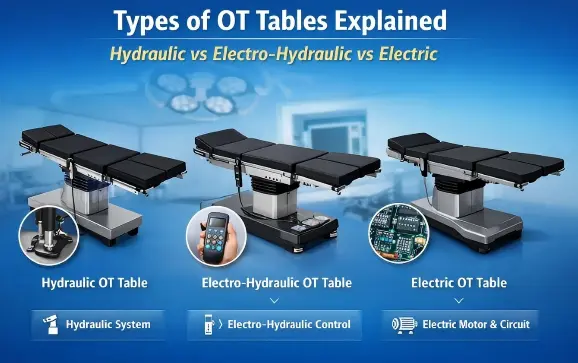
Electric vs Electro-Hydraulic vs Hydraulic: Technology Segment Breakdown
Four technologies. Four wildly different growth trajectories. That’s the real story hiding inside the powered operating tables market right now.
Market share split (current):
– Electric: 38.7%; it leads in precision positioning and smart OR integration
– Electro-hydraulic: 29.3%; a transitional hybrid that delivers high force output with electronic control
– Hydraulic: 18.5%; legacy tech that holds on in heavy-load applications, m
– Manual: 13.5%; now serves as backup and for resource-constrained settings
CAGR tells the replacement story:
– Electric: +6.8% to +8.5%
– Electro-hydraulic: +2.0% to +3.5%
– Hydraulic: -1.8% (shrinking)
– Manual: -2.1% (shrinking faster)
Electric is cannibalizing hydraulic and manual segments.
Smart & Connected Features Reshaping Modern Operating Tables
A hydraulic table just moves. An electric table remembers, reports, and reacts. That distinction is where the real product differentiation now lives, and it’s rewriting what “operating table technology” even means.
Position memory has become table stakes. High-end electric platforms now store 3-10+ preset positions—Trendelenburg, reverse Trendelenburg, lithotomy, seated—recallable with one touch from a handset or side panel.
Load monitoring is where safety engineering gets serious. Premium tables now handle 250-450 kg, with some rated at 1,000 lbs (454 kg) to accommodate bariatric cases. Infinium Medical flags this capacity threshold, paired with smart control systems, as a non-negotiable procurement checkbox. Built-in sensors track real-time load and flag center-of-gravity shifts as the tabletop slides longitudinally—critical for heavier patients where tipping risk isn’t theoretical.
Connectivity closes the loop on maintenance. Getinge’s “Connected Operating Table” concept pushes fault codes, usage hours, and sensor data to remote monitoring systems. The payoff: predictive maintenance scheduling, remote diagnostics, faster software updates. For procurement committees, this reframes the KPI conversation entirely—less about sticker price, more about reduced downtime and reliable turnover rates. That’s the metric hospital administrators now bring to budget meetings.
Regional Market Dynamics: North America, Europe, and Asia-Pacific
Geography changes the buying calculus. A hospital in Ohio and one in Chengdu are shopping for the same electric surgical table, but for different reasons, and that reshapes how manufacturers price, market, and support their products across regions.
North America buys on brand trust and system integration. GPOs and hospital networks negotiate in bulk. Their scoring criteria lean hard on clinical performance, automation depth, and how well a table talks to existing imaging and surgical navigation systems. Prices run high, but so does adoption of full lifecycle service contracts that bundle equipment, maintenance, and software upgrades together. It’s a mature market where capability beats cost.
Europe focuses on value procurement. Tender processes weight total cost of ownership, sustainability, and regulatory compliance, such as MDR, REACH, and VOC directives, just as heavily as clinical specs. Buyers want lower energy consumption, higher recyclable material content, and transparent maintenance costs baked into the bid. Healthcare infrastructure decisions pass through a compliance filter before performance ever enters the conversation.
Asia-Pacific is the growth engine, but it’s stratified. Tier-one hospitals in Shanghai, Seoul, and Singapore chase the same robotic-compatible, smart-control tables as North American flagship institutions. Tier-two and tier-three facilities prioritize a price-reliability balance, favoring mid-range and locally manufactured options. Hospital construction booms, rising medical tourism, and robotic surgical suite expansion are driving procurement volume regardless of tier. Each robotic OR typically requires one to two high-precision powered tables rated above 250-350 kg. This two-tiered buying pattern makes Asia-Pacific the region every manufacturer’s regional strategy now hinges on.
Key Demand Drivers Fueling Powered Operating Tables Adoption
Three things are pushing hospitals toward powered operating tables, and none are slowing down.
Aging populations are rewriting surgical caseloads. The WHO projects that by 2050, adults 60 and older will make up 22% of the global population—more than 1.5 billion people. That shift concentrates demand in orthopedics, cardiovascular, and oncology—departments where patients run heavier, procedures run longer, and positioning precision matters most. Some regions have seen orthopedic, cardiovascular, and bariatric surgery volumes climb over 30% in five years. Market models quantify the effect: rising surgical volumes and ASC expansion contribute about +1.2 percentage points to the market’s CAGR, while aging-driven orthopedic and cardiac case growth adds another +1.0 point. Hospitals respond by specifying electric tables rated above 250–300 kg with multi-axis control and Trendelenburg capability—hardware built for this patient profile.
Ambulatory surgical centers are changing what “compact” means. ASCs run tight schedules in small rooms, often sharing one OR across orthopedics, GI, and gynecology in a single day. That pushes them toward electric and electro-hydraulic platforms with preset positioning—tables that cut turnover time between cases rather than tables built for a single specialty. This channel drives that same +1.2 percentage point CAGR contribution alongside volume growth, and it’s concentrated in North America and Europe.
Hospital modernization is turning ergonomics into a line item. Integrated OR and robot-ready table upgrades add about +0.8 percentage points to CAGR; carbon-fiber radiolucent tabletops and imaging integration add another +0.6. But the quieter driver is occupational safety. The risk of musculoskeletal injury from manually repositioning heavy or critical patients is now baked into CAPEX justifications alongside patient-facing performance metrics—reshaping how procurement committees score every bid.
Why Electric Is Pulling Ahead
The numbers explain the shift. Electric systems run at 75-80% energy efficiency versus 40-55% for hydraulic, cutting energy costs 30-50% over a table’s lifespan. Maintenance drops to 1-2% annually, compared to 3-5% for hydraulic units burdened by oil leaks and seal replacements. MTBF for electric systems reaches 8,000-12,000 hours, nearly triple hydraulic’s 3,000-5,000 hours.
Precision is the other differentiator. Electric servo systems achieve 0.1-0.5mm positioning accuracy with over 20 programmable preset positions, 2-3x more precise than hydraulic alternatives. Smaller footprints (20-40% size reduction, no oil tank or hydraulic lines), lower noise, and native data connectivity for hospital asset management systems compound the value.
Yes, electric tables carry a 50-70% price premium over hydraulic models. But total cost of ownership over 10 years: electric systems run at 60-70% of hydraulic’s lifetime cost. The premium gets recovered, then some. For procurement teams calculating five-year budgets, that math increasingly favors electric, regardless of the higher sticker price.
Market Challenges: Cost, Compliance And Maintenance Barriers
Sticker shock is real. A high-end electric operating table costs USD 40,000-80,000 per unit. Standard hydraulic or manual models run USD 8,000-20,000. That 2-4x premium stalls purchasing committees in cost-sensitive markets.
Where the money goes:
– Mechanical structure and tabletop (stainless steel, carbon-fiber, at least 250-350 kg capacity): 25-35% of BOM
– Motorized drive system (4-8 independent motors with anti-pinch redundancy): 20-30%
– Control and electrical safety modules meeting IEC 60601-1: 15-25%
– Compliance testing and certification: 5-10%
– Channel, installation, training: 10-20%, rising another 10-15% in developing regions because of logistics and tariffs
Compliance Fragmentation Adds Hidden Cost
Regional divergence compounds the problem. Europe requires MDR 2017/745, IEC 60601-1, and IEC 60601-2-46. North America demands UL/CSA certification plus FDA clearance. EU type-testing alone can reach EUR 50,000-200,000, amortized across production volume.
Maintenance Complexity Scales With Automation
More motors and sensors mean more failure points. Electric tables need periodic diagnostics, sensor calibration, firmware updates, and cybersecurity patching for integrated OR platforms. Non-compliance carries real financial risk.
Leading Manufacturers And Competitive Landscape Analysis
Four companies dominate the benchmark set: Getinge/Maquet, STERIS, Stryker, and Hillrom/Baxter. They are the heavyweights, with large installed bases and channel coverage across entire hospital networks. Competitive analysis no longer stops at comparing a single SKU. Today, product breadth, seamless imaging and robotics integration, reliable service networks, and aggressive tender pricing matter more.
Their positioning breaks down by core strengths:
Getinge/Maquet leads the premium hybrid OR space, designing tables for integrated surgical workflows.
STERIS competes on portfolio breadth. They bundle infection control and OR efficiency solutions alongside their table hardware.
Stryker focuses on trauma and orthopedic specialty solutions, leading with ergonomic design.
Hillrom/Baxter pursues hospital-wide bundling. They rely on deep account penetration across multiple product categories.
M&A Is Rewriting Competitive Rules
Mergers and acquisitions are changing how procurement works. Baxter’s 2021 acquisition of Hillrom expanded its hospital footprint, opening opportunities for bundled selling across hospital beds and perioperative accounts. Buyers now face account-based bundles instead of standalone table bids. Getinge and Maquet followed a similar path. Bringing Maquet’s surgical brand under the Getinge umbrella created a comprehensive OR and critical-care supplier, strengthening their cross-selling in major tenders.
This shift is structural. Single-product competition is giving way to portfolio-level bidding. Smart buyers now ask if a supplier can deliver end-to-end OR coverage.
Regional Specialists Fill the Gaps
Regional and specialized companies fill the gaps where precision or agility beats sheer size. Mizuho OSI wins on specialty positioning. Skytron competes on value and modular design, and Lojer provides reliable European regional sourcing.
Grace Medy operates as a dedicated surgical table supplier. They manufacture multi-functional electric operating tables for distinct departments. They deliver high-load capacities and traction compatibility for orthopedics, precise positioning for gynecology, and adaptable setups for general surgery. Facilities choose them to get multi-disciplinary capabilities from an independent supplier.
Broader OEM manufacturers continue to undercut on price and offer deep customization. This suits budget-sensitive tenders, though buyers need strict QA diligence in those scenarios.
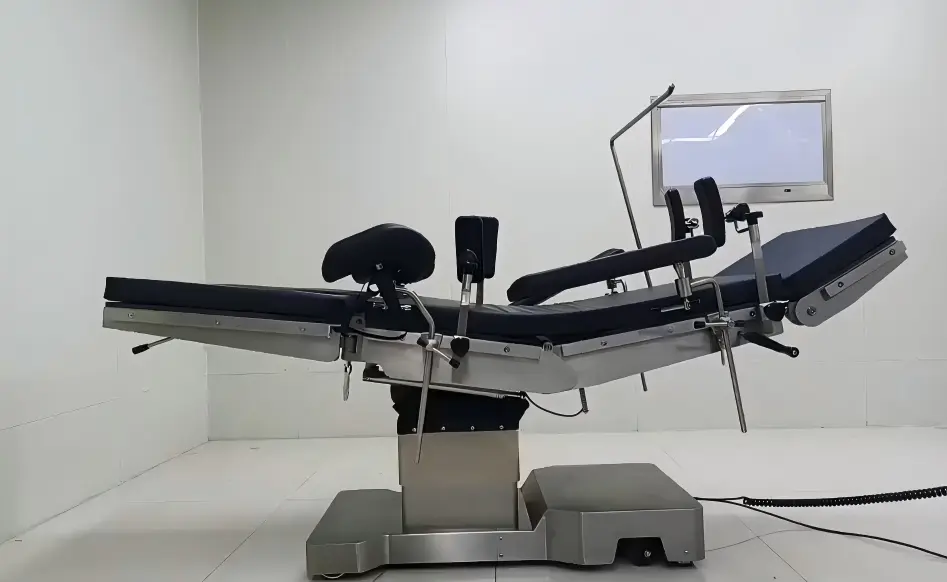
Future Outlook: Next 5-10 Years Growth Forecast For Powered Operating Tables
Run the numbers forward and the share shift gets stark.
Powered share climbs from ~68-70% today toward 80%+ by 2030
Could exceed 85% by 2035, based on compounding growth differentials
Mature markets (North America, Western Europe): manual-only tables shrink below 10% of installed base by 2030, tied to standard 8-12 year OR replacement cycles
Hydraulic-without-electric-assist likely drops below 15% of new purchases before 2028-2030
Emerging markets follow a different script. New hospital builds specify electric or electromechanical as baseline, skipping manual entirely to avoid retrofit costs later. First comes mid-range powered tables with basic connectivity through 2030. Then robotic-ready upgrades follow. By 2030, robotic and imaging compatibility won’t be a differentiator anymore. It’ll be a tender requirement.
Conclusion
The powered operating tables market is climbing steadily, driven by aging populations demanding more surgeries, hospitals racing to digitize their ORs, and manufacturers adding smarter automation to electric surgical tables. This is a fundamental shift in how operating rooms function, with Asia-Pacific emerging as the growth engine and North America and Europe pushing innovation boundaries.
For procurement managers and industry analysts, waiting means falling behind competitors who are already forming next-gen surgical table technology partnerships. Grace Medy has been tracking these shifts and can help you with vendor selection, ROI calculations, and compliance hurdles before you commit capital.